

Weekly reports tell you how the week went after it’s too late to change it. Same-day numbers let you fix a bad Tuesday on Wednesday.
Introduction
When I worked as a continuous improvement leader at Greenlee Textron (now part of Emerson), I learned that good data is the foundation of any change that sticks. You can’t fix a process you can’t see, and you can’t prove a new idea worked without numbers to compare against.
The problem was getting those numbers. The data lived in different places, and the reports built from it came out monthly at best, sometimes quarterly. By the time we saw a problem, it had already cost us weeks.
Most manufacturers we work with at Digital Industrial Systems aren’t that far behind, but they’re not far ahead either. They run on weekly reports. Someone pulls numbers from the ERP, a few spreadsheets, and maybe a whiteboard, and by Friday leadership sees how the week went. But by Friday, the week is over. A short day on Tuesday can’t be made up if nobody knows about it until the weekend.
Moving to same-day numbers isn’t about more reports. It’s about giving the right people the right few numbers while there’s still time to act.
01 / The problem
Why weekly reports hide problems
A weekly report tells you what already happened. It averages good days and bad days together, so a bad Tuesday disappears into an okay week. And because it takes real time to build, it usually reflects one person’s version of the numbers, not a view everyone shares.
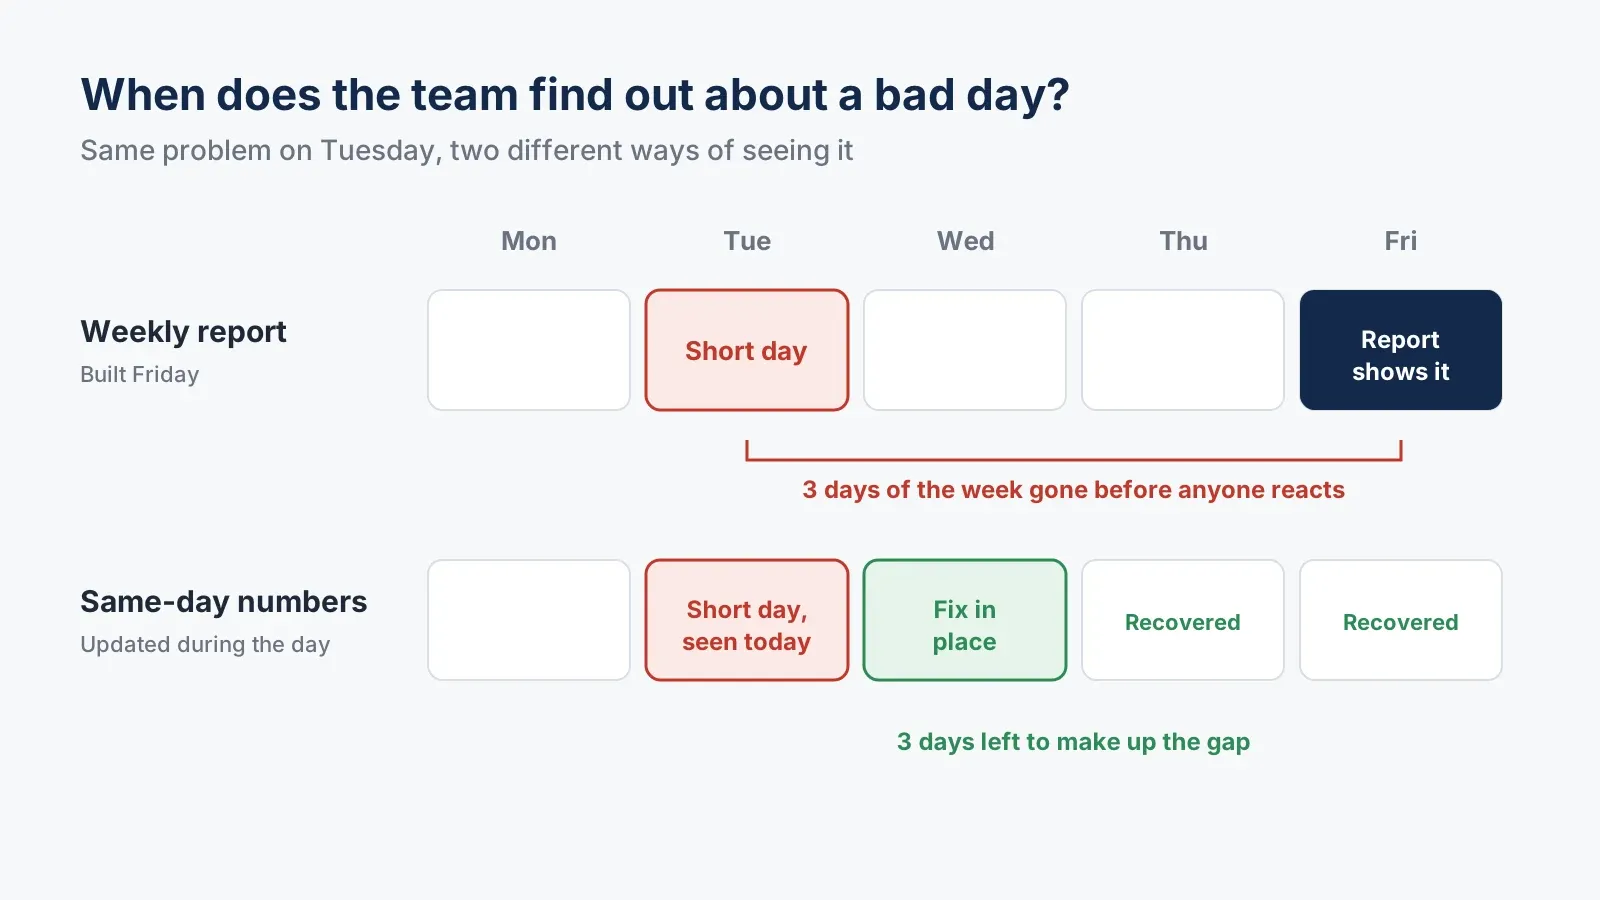 The same short day on Tuesday. With a weekly report, the team finds out on Friday. With same-day numbers, they have the rest of the week to make it up.
A weekly report doesn’t just arrive late. It averages your worst day into an okay week, so the problem never looks as big as it was.
02 / The cause
Where the delay comes from
In most plants, the data already exists. It’s just spread out: job status in one system, output on paper or a whiteboard, sales numbers in another spreadsheet. The delay comes from the work of pulling it together, not from a lack of information.
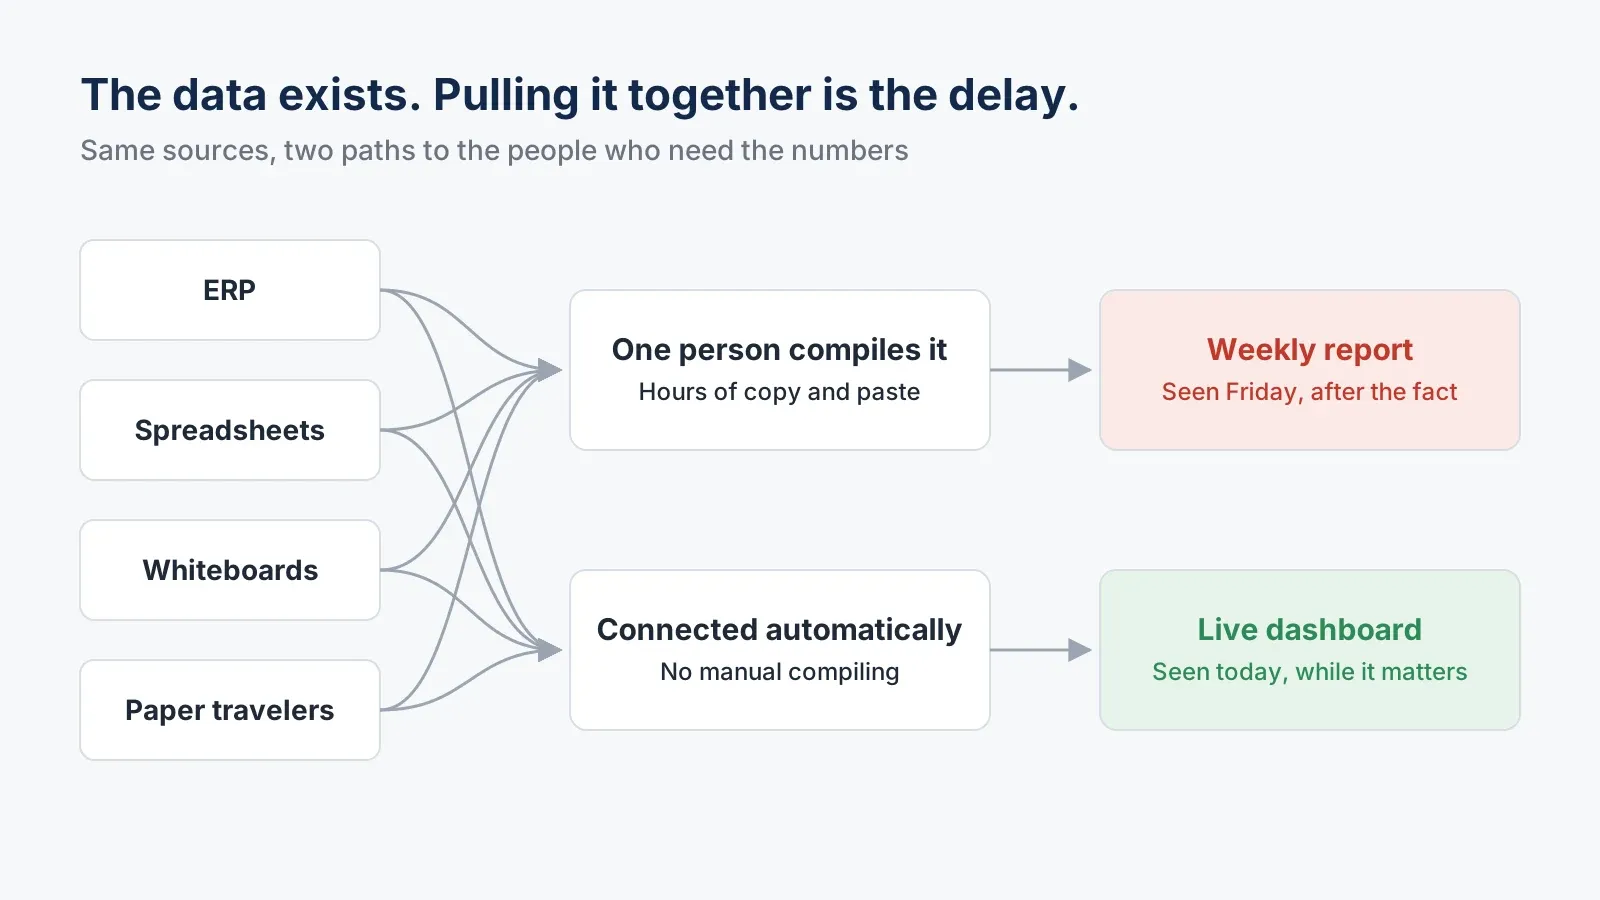 The sources are the same either way. What changes is whether a person compiles them once a week or they’re connected and visible all day.
03 / The numbers
What same-day numbers should include
You don’t need everything live. Start with the numbers someone can act on today:
- Planned vs. actual output for the day or week
- Rework and defects, and which stage they come from
- Job status, so sales and customer service stop calling the floor to ask
- Margin, not just revenue, so leadership knows which work actually pays
04 / Proof
A real example: a countertop fabricator
One client, a countertop fabrication and installation company, started with a narrow goal: help the sales team see where their jobs stood.
We built a dashboard that let reps sort active jobs by revenue, job ID, and process step. Instead of calling production for updates, they could look.
Once leadership saw live data, they got excited about having real visibility into the operation, and they wanted it everywhere. We see this often: one working dashboard makes people realize how much they’ve been missing. The project grew from sales into the rest of the company, and we ended up building three views:
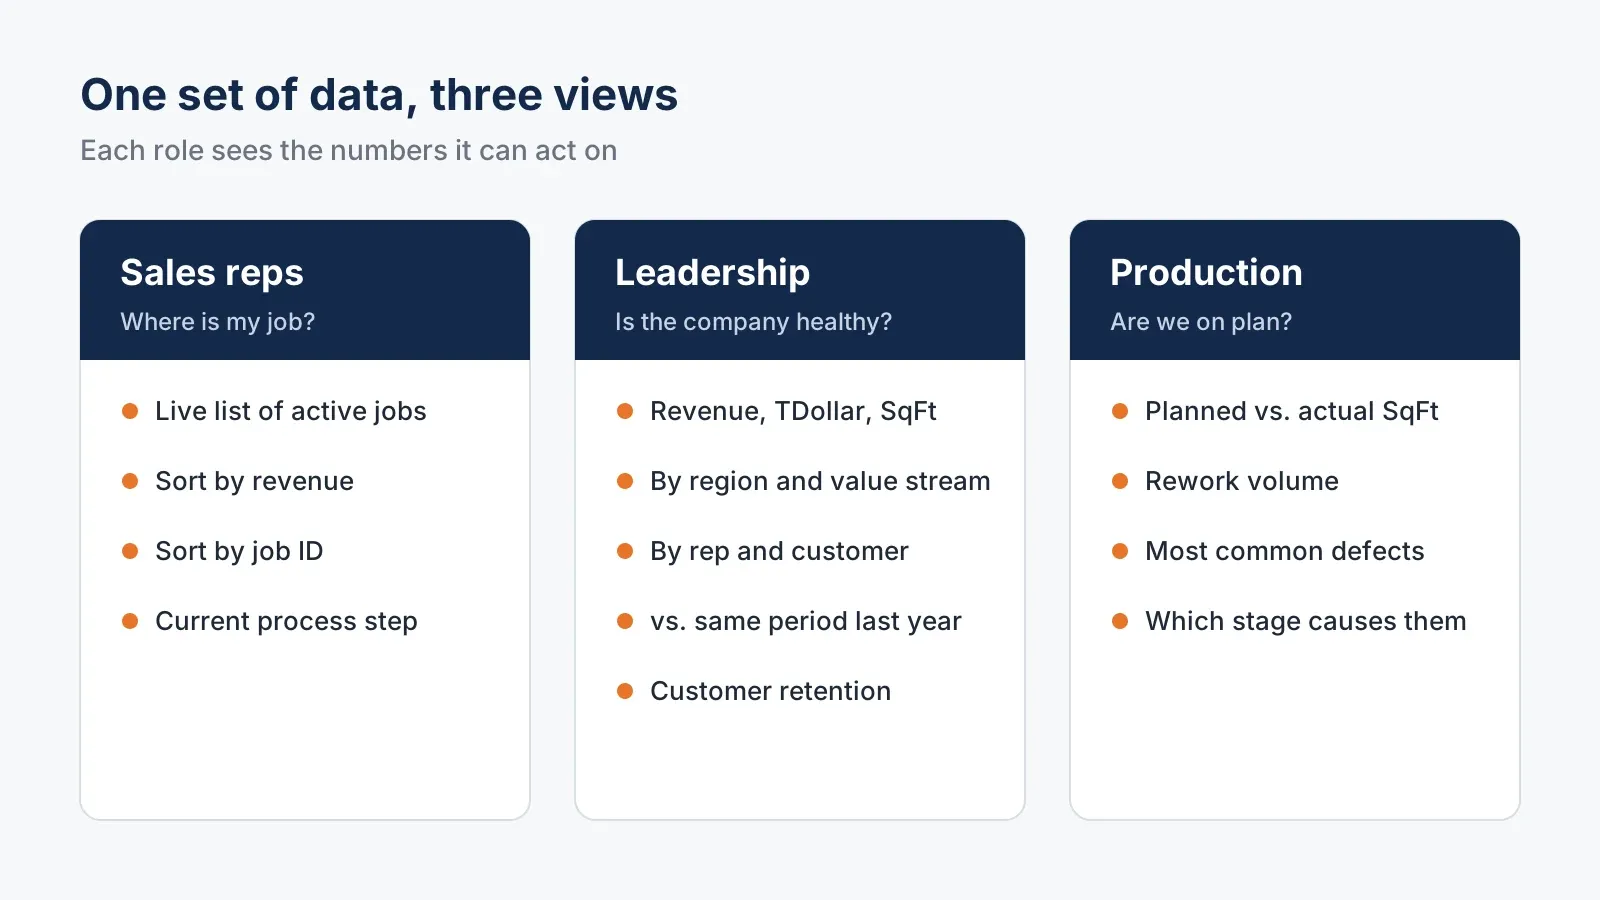 Same data, three views. Each role sees the numbers it can act on.
For sales reps: the live job list.
For leadership: a company health dashboard built on TDollar, which is revenue minus material cost. Revenue alone can make a customer look great. TDollar shows what that customer actually contributes. Leadership could compare revenue, TDollar, and square footage by region, value stream, rep, and customer, against the same period last year, and watch customer retention.
For production: a board showing planned vs. actual square footage for the week. If the plan was 5,000 square feet, the team could see where they stood today, not on Friday. The same board tracked rework and which production stage caused the most defects, so improvement work could start in the right place.
The biggest change wasn’t any single chart. It was that sales, leadership, and the floor were finally looking at the same numbers while there was still time to do something about them.
05 / Lessons
What we learned
Start in one place. We didn’t try to fix reporting for the whole company at once. One working dashboard in sales did more to build support than any plan could have.
Give each role its own view. A rep, a plant manager, and an owner need different numbers. One giant dashboard for everyone ends up useful to no one.
Track margin, not just sales. A metric like TDollar changes conversations about which customers and jobs to chase.
06 / First steps
Where to start, even without software
If you’re on weekly reports today, you can start Monday:
- Pick three numbers that matter most to your floor.
- Put planned vs. actual on a whiteboard, by shift.
- Update it at least twice a day.
- Review it in a short daily meeting and ask one question: what got in the way?
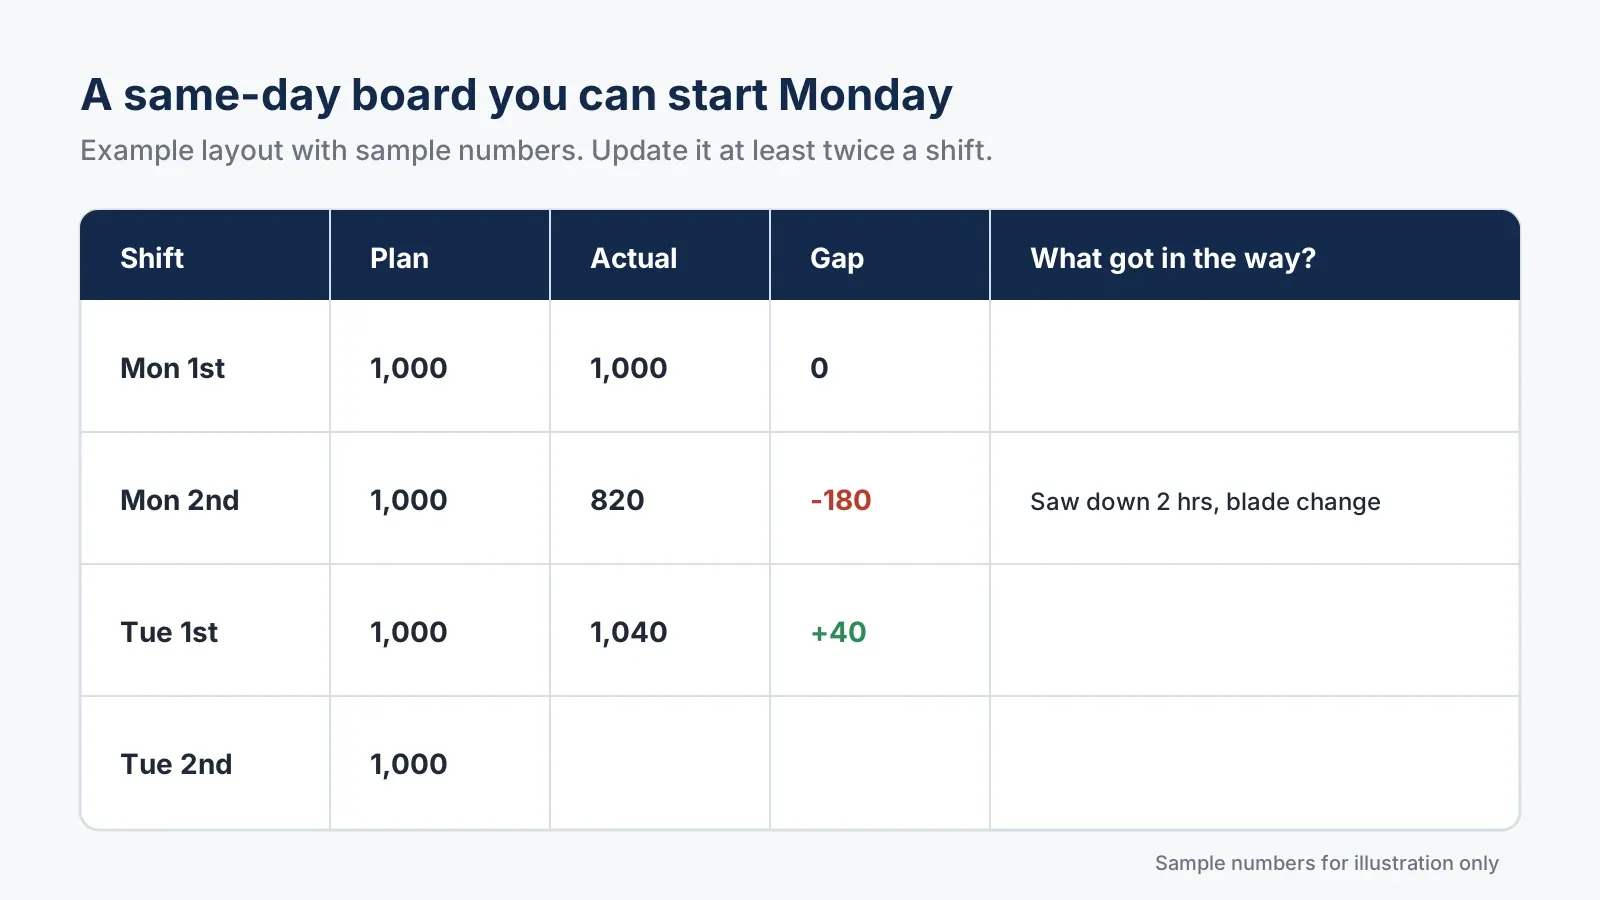 A simple layout to copy. The “what got in the way” column is where the improvement ideas come from. Sample numbers for illustration only.
Once that habit sticks, software makes it faster and more accurate. Without the habit, software just makes a nicer weekly report.
See what your operation looks like same-day
The lowest-risk first step isn’t a big software project. It’s a conversation about where your numbers live today, who needs them, and which one dashboard would make the biggest difference first.
Not ready to talk yet? Read our Operations Visibility overview, or see how a Manufacturing Operations Assessment works.


